

When it comes to robotic process automation (RPA), Blue Prism is a standout platform that enables organizations to automate their business processes effectively. While creating automated solutions using Blue Prism is essential, debugging plays a critical role in ensuring smooth operation and efficient execution. In this blog post, we will delve into some invaluable debugging techniques in Blue Prism that can help you pinpoint and resolve issues, ultimately optimizing your automation workflows.
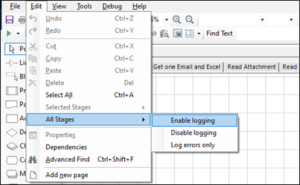
1. Enable Logging
Blue Prism offers comprehensive logging capabilities to track process execution and identify potential errors. By enabling logging, you can gain insights into the system’s behavior, allowing you to trace the flow of execution and locate issues accurately. Depending on the level of detail required, logging can be enabled at object, process, or business object levels. Analyzing logs can provide essential information for troubleshooting and enhancing your automation solutions.
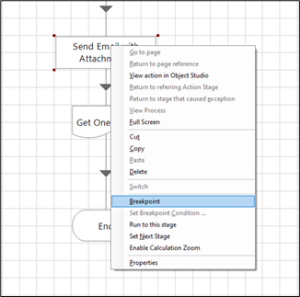
2. Use Breakpoints
Breakpoints allow you to pause the debugging process at any point. Once paused, you can choose to Step, Step Into, Step Over, or Stop the debugging process.
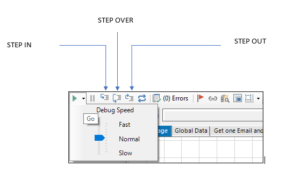
3. Step
The Step function allows you to move through each stage of the workflow one at a time, providing a detailed view of the execution flow. This can be useful when navigating complex workflows with multiple stages. (Shortcut F11)
4. Step Over
Step Over enables you to move to the next stage in the workflow without entering into the details of the current stage. This can help streamline the debugging process and focus on the overall flow of execution. (Shortcut F10)
5. Step Out
Step Out allows you to exit the current stage and return to the parent stage, process, or action. This can be helpful in scenarios where you need to quickly navigate back to the main workflow. (Shortcut Shift+F11)
6. Exception Handling
Proper exception handling is essential for robust automation design. Blue Prism offers robust exception handling capabilities to manage errors and exceptions during process execution effectively. By implementing effective exception handling techniques, you can handle errors gracefully, perform specific actions or retries, and recover from failures seamlessly. This enhances the reliability of your automation solutions.
7. Utilize the Blue Prism Developer Tools
Blue Prism provides developer tools that can aid in debugging and troubleshooting. The Application Modeler allows you to interact with target applications and verify selectors, while the Object Viewer provides a detailed view of application hierarchy and properties. Leveraging these tools can help identify and resolve object recognition and interaction issues.
8. Collaboration and Documentation
Collaboration and documentation are key aspects of effective debugging. Working with team members and maintaining clear documentation of the automation process, including inputs, outputs, and known issues, promotes effective communication and problem-solving. Collaborative efforts ensure a holistic approach to debugging, leveraging collective expertise to identify and resolve issues efficiently.
These debugging techniques are versatile and can be applied in various scenarios to quickly debug complex workflows of any length.
Conclusion
Debugging is crucial in the automation development lifecycle, and employing effective techniques is essential for successful Blue Prism implementations. By enabling logging, using breakpoints, implementing proper exception handling, leveraging developer tools, and fostering collaboration, you can troubleshoot and resolve issues within your automation solutions effectively. With these techniques, you can address challenges and ensure the smooth functioning of your automation solutions.
Please rephrase this sentence.